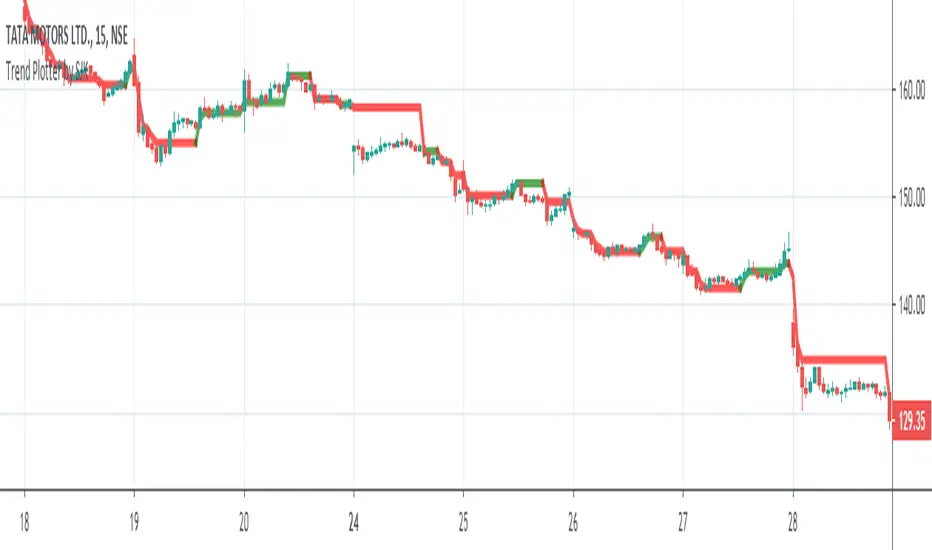
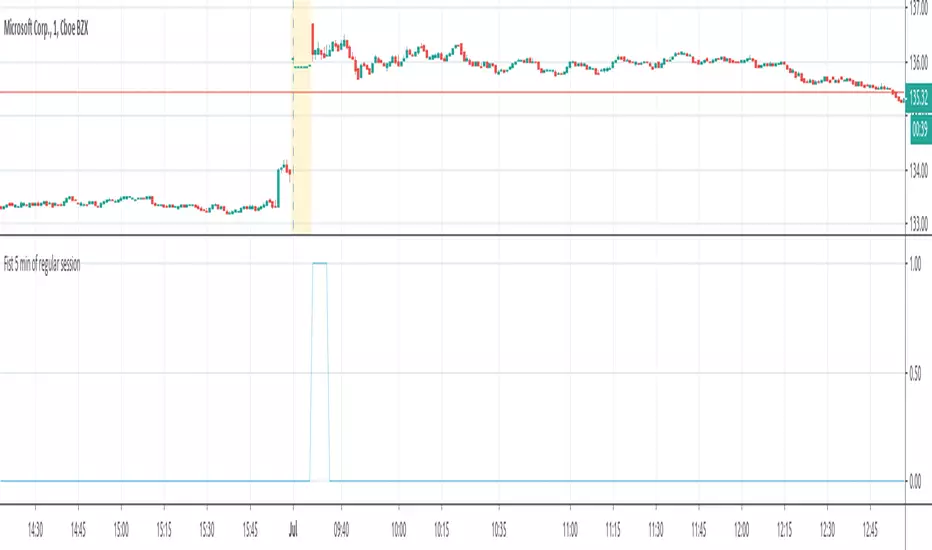
Trend Plotter by SJKThe script is on construction phase, but still can be used. This is a trend plotter based on ATR. Use a minimum time frame of 15 minutes. Wont work satisfactorily below that. Optimum is 30 minutes. Go short when the stock is under 200 day MA and go long when the stock is above 200 day MA. No buy or sell signal added, but can be used based on the color of the line plotted.
在腳本中搜尋"the script"
Higher Timeframe EMA @ silenThunderrThe Script is Used for Exponential Moving Average which are fixed for Daily and Weekly.
Can Be used in any Timeframe but EMA are fixed to Daily and Weekly only.
One option of Open EMA is kept which can be modified in settings.
Turn On/OFF various EMA's and enjoy the play of EMA's
Its can change colours if selected in the Settings.
OFFSET is also available.
Upslope is White and Downwards is Yellow. (I use Dark Theme hence White u can change the colour to what ever u wish )
All in settings

daddycooltechThe script is based on analysing the trend and following the patterns that develop once we have a signal of buy or sell developing on charts.
What doe it do?
it uses support and resistance along with transient zone strategy and identifies proper entry and exit levels.
How to use it?
for using this you need to follow the green or red triangles that are developing on charts and accordingly place buy or sell orders with a stop loss at a particular rejection level.
What market it is meant for?
it works in both bull n bear market with a condition of a proper time frame.This can't be used for scalping you should have patience while you try working with this strategy.

Stoch tripleThe script has combined the three Stochastic oscillators into one.
It analysed divergences of indicators depending on the flow of stock price, a circle mark or text mark displayed.
The maroon and red marks mean a fall, while the green and lime marks mean a rise.
Especially red and lime of mark are strong signs of decline or rise.
I hope you can make a successful investment by using three Stochastic oscillators properly.

5MAThe script contains five moving averages: MA50 , MA100 , MA200 , EMA30 , SMMA10 .
You can adapt it for yourself and use it on any markets.

Cumulative VolumeThe script shows how to accumulate volume values during a defined session/period.
The input is the period to use for accumulation. "D" is the default value, useful to view data for each session.

Two Lines Diferent M (derivate)The script is only for information about two lines of diferent derivates, one with 10 candles and the another with 30 candles, the diferent slope of those lines tangents shows an indication of a tendencial if the value of the instrument is bearish or bullish.
Its aplicable to all instruments in high volatility times.
Support and Resistance plotterThe script uses high/low/higher high/lower low for Support and Resistance identification but takes into account only pivots with wick making low/high opposite to candle body. Such candles point to hard market swings into during candle timeframe.
Price usually come bake to such levels and make double top/bottom, divergences on different osc or starts a new trend if this level is broken.
If Support lvl and Resistance lvl meets the movement of price in the direction from this combined lvl is much accelerated.
examples

Rolling Moving Average, SMA/EMA, for IPO stocksThe script replicates the standard EMA/SMA used by tradingview, but also adds an estimate for the first X periods, where X is the length of the moving average. This allows for an estimate of support resistance in IPO stocks, when fewer date is available


Max of VWAP of last three daysThe script searches for max values of last three days and then calculates average of those values

BolingerBands_Contraction_Bitcoin_dailyThe script visualises the contraction or tightness of the Bollinger Bands (example Bitcoin on the daily timeframe). The contraction values have to be adjusted for each asset/coin/stock and timeframe. See what works for you.

RSI Trendchange for BTC by OSHELLThe script indicates typical turning points on RSI for bitcoin. Buying indicator is more reliable especially for short term trades.

Golden Ratio Multiplier: Multiplied Moving AveragesThe script for plotting DMAs from the study made by @PositiveCrypto (twitter)

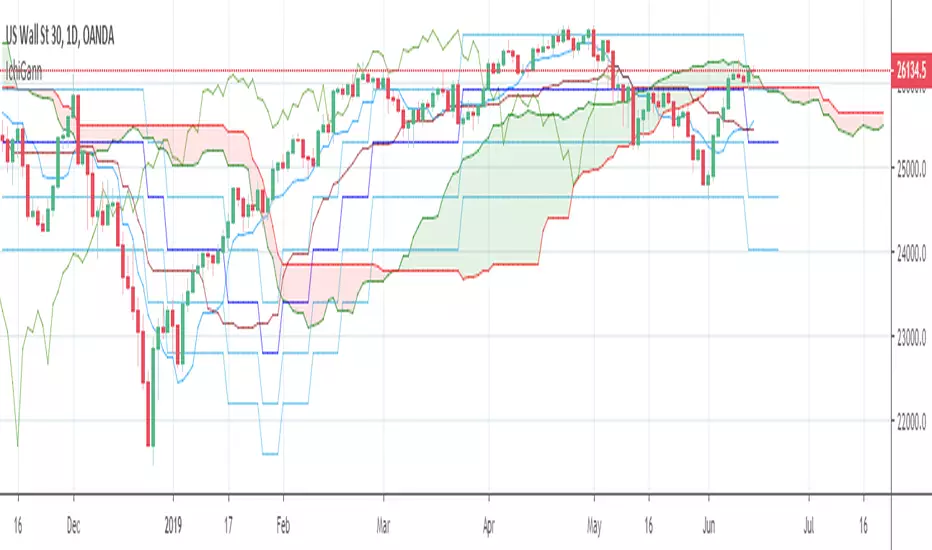
Ichmoku + GannThe script combines Ichimoku Clouds with Gann levels. Kijunsen is used as basis of calculation of 4 Gann levels above and below it. By default Gann Leves at 360 degrees are plotted but one can choose the desired degrees separation.
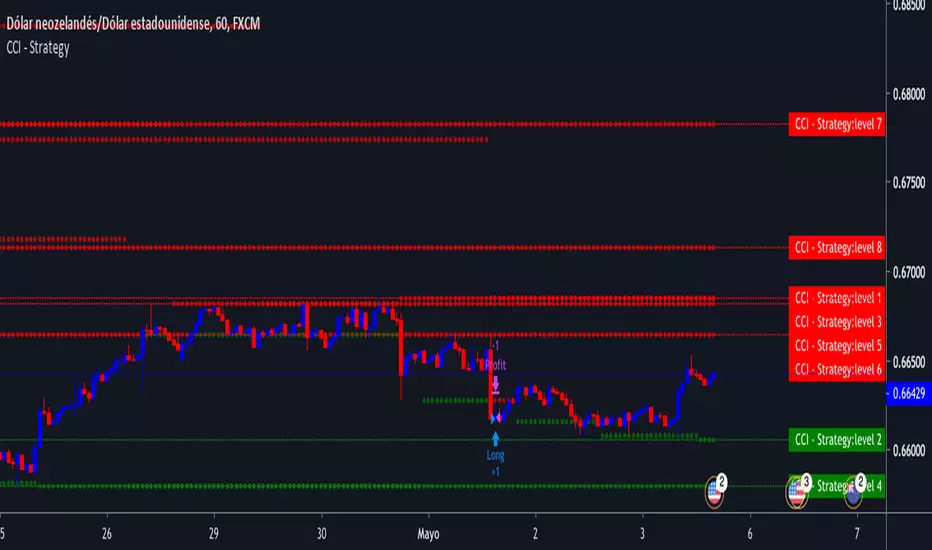
RSI-Stoch-CCI with S/RThe script works with RSI and Stoch to make sure the price is oversold or overbought, but also use CCI to identify the cyclical trends. If the price is on support or resistance and the indicators are oversold or overbought and alert there's an option to buy or sell.
Doji's/Engulfing Candles/Supertrend v1.0The Script locates Bearish/Bullish Engulfing Candlesticks and Dojis in combination with Supertrend v1.0.
Original Authors: HPotter + Rajandran R


Volume Power K2The script is reading the accumulation and distribution then the RSI read these values.
